Market Outlook
December 26, 2016
Market Cues
Domestic Indices
Chg (%)
(Pts)
(Close)
Indian markets are expected to open negative tracking the SGX Nifty.
BSE Sensex
0.2
61
26,041
Nifty
0.1
7
7,986
The US markets traded on a slightly higher tone on Friday, capping off an
uneventful week in the market. After trading flat for most of the day, the S&P 500
Mid Cap
(0.4)
(48)
11,761
Index rose 0.1%, to close at 2,264. Most sectors finished mixed-to-lower. Health was
Small Cap
(0.0)
(5)
11,797
the biggest outlier, rising 0.7%. The Dow Jones Industrial Average inched up 0.1%,
Bankex
(0.2)
(31)
20,428
to 19,934. The technology-heavy Nasdaq Composite Index rose 0.3% to 5,463.
The U.K. markets closed with a small rise on Friday, but gains were limited as a
Global Indices
Chg (%)
(Pts)
(Close)
flurry of Justice Department settlements sent ripples through the banking sector. The
Dow Jones
0.1
14.9
19,934
FTSE 100 finished up by 0.06%, at 7,068 after swaying between small gains and
Nasdaq
0.3
15.3
5,463
losses in a holiday-shortened session.
FTSE
0.1
4.5
7,068
Sensex on Friday reclaimed the key 26,000 mark by recovering 61 points, helped by
Nikkei
(0.1)
(17)
19,428
gains in pharma, auto and capital goods. Intra-day, markets shuttled between
7,942 and 8,023. For the major part of the session, both Sensex and the Nifty
Hang Seng
(0.3)
(61)
21,575
moved in a tight range in tandem with emerging markets, which remained subdued
Shanghai Com
(0.9)
(29)
3,110
on sustained foreign fund outflows.
Advances / Declines
BSE
NSE
News Analysis
Advances
1,238
291
Whirlpool eyes $1 billion revenue by 2020
Declines
1,337
1,329
Maruti Suzuki India to get 10,000 Balenos from Suzuki; Gujarat plant this fiscal
Detailed analysis on Pg2
Unchanged
179
56
Investor’s Ready Reckoner
Volumes (` Cr)
Key Domestic & Global Indicators
BSE
2,403
Stock Watch: Latest investment recommendations on 150+ stocks
NSE
15,266
Refer Pg5 onwards
Top Picks
Net Inflows (` Cr)
Net
Mtd
Ytd
CMP
Target
Upside
Company
Sector
Rating
FII
(1,108)
(2,810)
24,467
(`)
(`)
(%)
Amara Raja Batt. Auto & Auto Ancill.
Buy
886
1,167
31.7
MFs
1,085
2,248
40,434
Alkem Laboratories Pharmaceuticals
Buy
1,601
1,989
24.2
HCL Tech
IT
Buy
794
1,000
25.9
Top Gainers
Price (`)
Chg (%)
Power Grid Corp. Power
Buy
182
223
22.3
Mmtc
52
6.3
Navkar Corp.
Others
Buy
162
265
63.8
Bajfinance
809
5.6
More Top Picks on Pg3
Cipla
583
4.0
Key Upcoming Events
Indianb
209
4.0
Previous
Consensus
Date
Region
Event Description
Reading
Expectations
Hindcopper
59
3.9
Dec 27 US
Initial Jobless Claims
275.00
--
Dec 29 US
Consumer Confidence
107.1
108.5
Top Losers
Price (`)
Chg (%)
Jan 01 China
PMI Manufacturing
51.7
51.6
Divislab
866
(21.9)
Jan 02 Germany Unemployment Change (000’s)
(5.00)
(5.00)
Bharatfin
520
(6.3)
Jan 03 Germany PMI Manufacturing
55.5
55.5
More Events on Pg4
Cadilahc
338
(5.1)
Deltacorp
98
(3.9)
Pfc
120
(3.8)
As on December 23, 2016
Market Outlook
December 26, 2016
News Analysis
Whirlpool eyes $1 billion revenue by 2020
Home appliances maker Whirlpool is eyeing $1 billion revenue by 2020 on the
back of new product innovations and growing Indian economy. India is a growth
market for Whirlpool and with the growing economy; company sees a lot of fuel in
discretionary space. Company believes hat it has got plenty of opportunity in
categories it operates.
Whirlpool reported a turnover of
`3,488cr in the financial year
2015-16.
Company is focusing on expanding beyond key categories i.e. refrigerators and
washers. It had spent `75cr capex in 2015-16. In current financial year, company
plans to take this number up by 25% while for the next fiscal, company intends to
increase its capex further by 50%.
Maruti Suzuki India to get 10,000 Balenos from Suzuki; Gujarat
plant this fiscal
Maruti Suzuki expects to receive around 10,000 units of premium hatchback
Baleno this fiscal from the upcoming Gujarat plant of its parent Suzuki that will
start production from early next year. The Hansalpur—based facility is the Suzuki
Motor Corp’s first wholly—owned unit in India. The Gujarat project is on schedule
and will start selling cars made in Gujarat from February. During current fiscal
about 10,000 cars from Gujarat will be produced and delivered to MSIL for sale.
Suzuki has envisaged a total investment of around USD 1,400 million on the plant
which will house two vehicle assembly lines of 2.5 lakh units per annum each and
an engine plant. It will roll out Baleno from the first assembly line. Suzuki will
supply vehicles and components exclusively to MSI from the plant. India is the
biggest market for Suzuki, which owns 56 per cent of Maruti Suzuki India — the
country’s biggest automaker controlling nearly half of the market. MSI’s two units
at Gurgaon and Manesar have a total production capacity of 1.5 million units
annual.
Economic and Political News
CPI inflation may average 5.3% in 2017; rate cut likely: Nomura
Cash withdrawal restrictions likely to continue beyond Dec 30
How Modi govt lobbied Moody’s for ratings upgrade, but failed
Corporate News
ONGC to pay over $1.2 billion for GSPC stake buy
Balrampur Chini gets green nod for Rs 72-cr expansion project
Tata Steel to acquire BRPL at enterprise value of Rs 900 crore
Market Outlook
December 26, 2016
Top Picks
Large Cap
Market Cap
CMP
Target
Upside
Company
Rationale
(` Cr)
(`)
(`)
(%)
To outpace battery industry growth due to better
Amara Raja Batteries
15,135
886
1,167
31.7
technological products leading to market share gains in
both the automotive OEM and replacement segments.
Strong growth in domestic business due to its leadership in
Alkem Laboratories
19,145
1,601
1,989
24.2
acute therapeutic segment. Alkem expects to launch more
products in USA, which bodes for its international business.
The stock is trading at attractive valuations and is factoring
HCL Tech
1,12,060
794
1,000
25.9
all the bad news.
Back on the growth trend; expect a long term growth of 14%
Infosys
2,27,237
989
1,249
26.2
to be a US$20bn in FY2020.
Strong order backlog and improvement in execution would
Larsen & Tourbo
1,24,694
1,337
1,634
22.2
trigger the growth for the L&T
One of the largest pharma companies with strong
international presence. It has a rich pipeline of ANDAs
Lupin
65,244
1,445
1,809
25.2
which is also one of the largest among the generic
companies.
Going forward, we expect the company to report strong
Power Grid Corporation
95,424
182
223
22.3
top-line CAGR of ~16% and bottom-line CAGR of ~19%
over FY16-18 on back of strong capitalization guidance
Source: Company, Angel Research
Mid Cap
Market Cap
CMP
Target
Upside
Company
Rationale
(` Cr)
(`)
(`)
(%)
We expect the company would report strong profitability
Asian Granito
645
214
351
63.7
owing to better product mix, higher B2C sales and
amalgamation synergy.
Among the top 4 players in the consumer durables segment.
Bajaj Electricals
2,144
212
274
29.2
Improved profitability backed by turn around in E&P
segment. Strong order book lends earnings visibility.
Favourable outlook for AC industry augurs well for Cooling
Blue Star
4,282
448
634
41.4
products business which is outgrowing the market. EMPPAC
division's is likely to turn around on improving economy
With a focus on the low and medium income (LMI)
Dewan Housing Finance
7,324
234
350
49.6
consumer segment, the company has increased its presence
in tier-II & III cities where the growth opportunity is immense.
Strong loan growth backed by diversified loan portfolio and
adequate CAR. ROE & ROA likely to remain decent as risk of
Equitas Holdings
4,796
143
235
64.3
dilution remains low. Attractive valuations considering
growth.
Economic recovery to have favourable impact on advertising
& circulation revenue growth. Further, the acquisition of a
Jagran Prakashan
5,500
168
225
33.7
radio business (Radio City) would also boost the company's
revenue growth.
Speedier execution and speedier sales, strong revenue
Mahindra Lifespace
1,449
353
522
47.9
visibilty in short-to-long run, attractive valuations
We expect the company to report strong growth on back of
healthy growth in domestic branded sales (owing to
Mirza International
1,006
84
107
28.0
aggressive ad spend and addition in the number of EBOs &
multi-brand outlets [MBOs]) and healthy export revenues.
Massive capacity expansion along with rail advantage at
Navkar Corporation
2,307
162
265
63.8
ICD as well CFS augurs well for the company.
Strong brands and distribution network would boost growth
Siyaram Silk Mills
1,132
1,207
1,605
33.0
going ahead. Stock currently trades at an inexpensive
valuation.
Market leadership in Hindi news genre and no. 2 viewership
ranking in English news genre, exit from the radio business,
TV Today Network
1,546
259
385
48.6
and anticipated growth in ad spends by corporate to benefit
the stock.
Source: Company, Angel Research
Market Outlook
December 26, 2016
Key Upcoming Events
Global economic events release calendar
Date
Time
Country
Event Description
Unit
Period
Bloomberg Data
Last Reported Estimated
Dec 27, 2016
7:00PM
US
Initial Jobless claims
Thousands
Dec 24
275.00
--
Dec 29, 2016
8:30PM
US
Consumer Confidence
S.A./ 1985=100
Dec
107.10
108.50
Jan 1, 2017
6:30AM
China
PMI Manufacturing
Value
Dec
51.70
51.60
Jan 2, 2017
2:25PM
Germany
Unemployment change (000's)
Thousands
Dec
(5.00)
(5.00)
Jan 3, 2017
2:25PM
Germany
PMI Manufacturing
Value
Dec F
55.50
55.50
3:00PM
UK
PMI Manufacturing
Value
Dec
53.40
53.20
Jan 4, 2017
2:25PM
Germany
PMI Services
Value
Dec F
53.80
53.80
Jan 6, 2017
3:30PM
Euro Zone
Euro-Zone Consumer Confidence
Value
Dec F
(5.10)
(5.80)
7:00PM
US
Change in Nonfarm payrolls
Thousands
Dec
178.00
175.00
7:00PM
US
Unnemployment rate
%
Dec
4.60
4.70
Jan 8, 2017
China
Exports YoY%
% Change
Dec
(1.60)
--
Jan 9, 2017
China
Consumer Price Index (YoY)
% Change
Dec
2.30
--
Jan 10, 2017
India
Imports YoY%
% Change
Dec
10.40
--
India
Exports YoY%
% Change
Dec
2.30
--
Jan 11, 2017
3:00PM
UK
Industrial Production (YoY)
% Change
Nov
(1.10)
--
Jan 12, 2017
US
Producer Price Index (mom)
% Change
Dec
--
--
Jan 13, 2017
5:30PM
India
Industrial Production YoY
% Change
Nov
(1.90)
--
Jan 16, 2017
12:00PM
India
Monthly Wholesale Prices YoY%
% Change
Dec
3.15
--
Jan 17, 2017
3:00PM
UK
CPI (YoY)
% Change
Dec
1.20
--
China
Industrial Production (YoY)
% Change
Dec
6.20
--
China
Real GDP (YoY)
% Change
4Q
6.70
--
Jan 18, 2017
7:00PM
US
Consumer price index (mom)
% Change
Dec
0.20
--
3:30PM
Euro Zone
Euro-Zone CPI (YoY)
%
Dec F
0.60
--
3:00PM
UK
Jobless claims change
% Change
Dec
2.40
--
7:45PM
US
Industrial Production
%
Dec
(0.44)
--
Jan 19, 2017
7:00PM
US
Building permits
Thousands
Dec
1,201.00
--
6:15PM
Euro Zone
ECB announces interest rates
%
Jan 19
--
--
8:30PM
US
Existing home sales
Million
Dec
5.61
--
Source: Bloomberg, Angel Research
Market Outlook
December 26, 2016
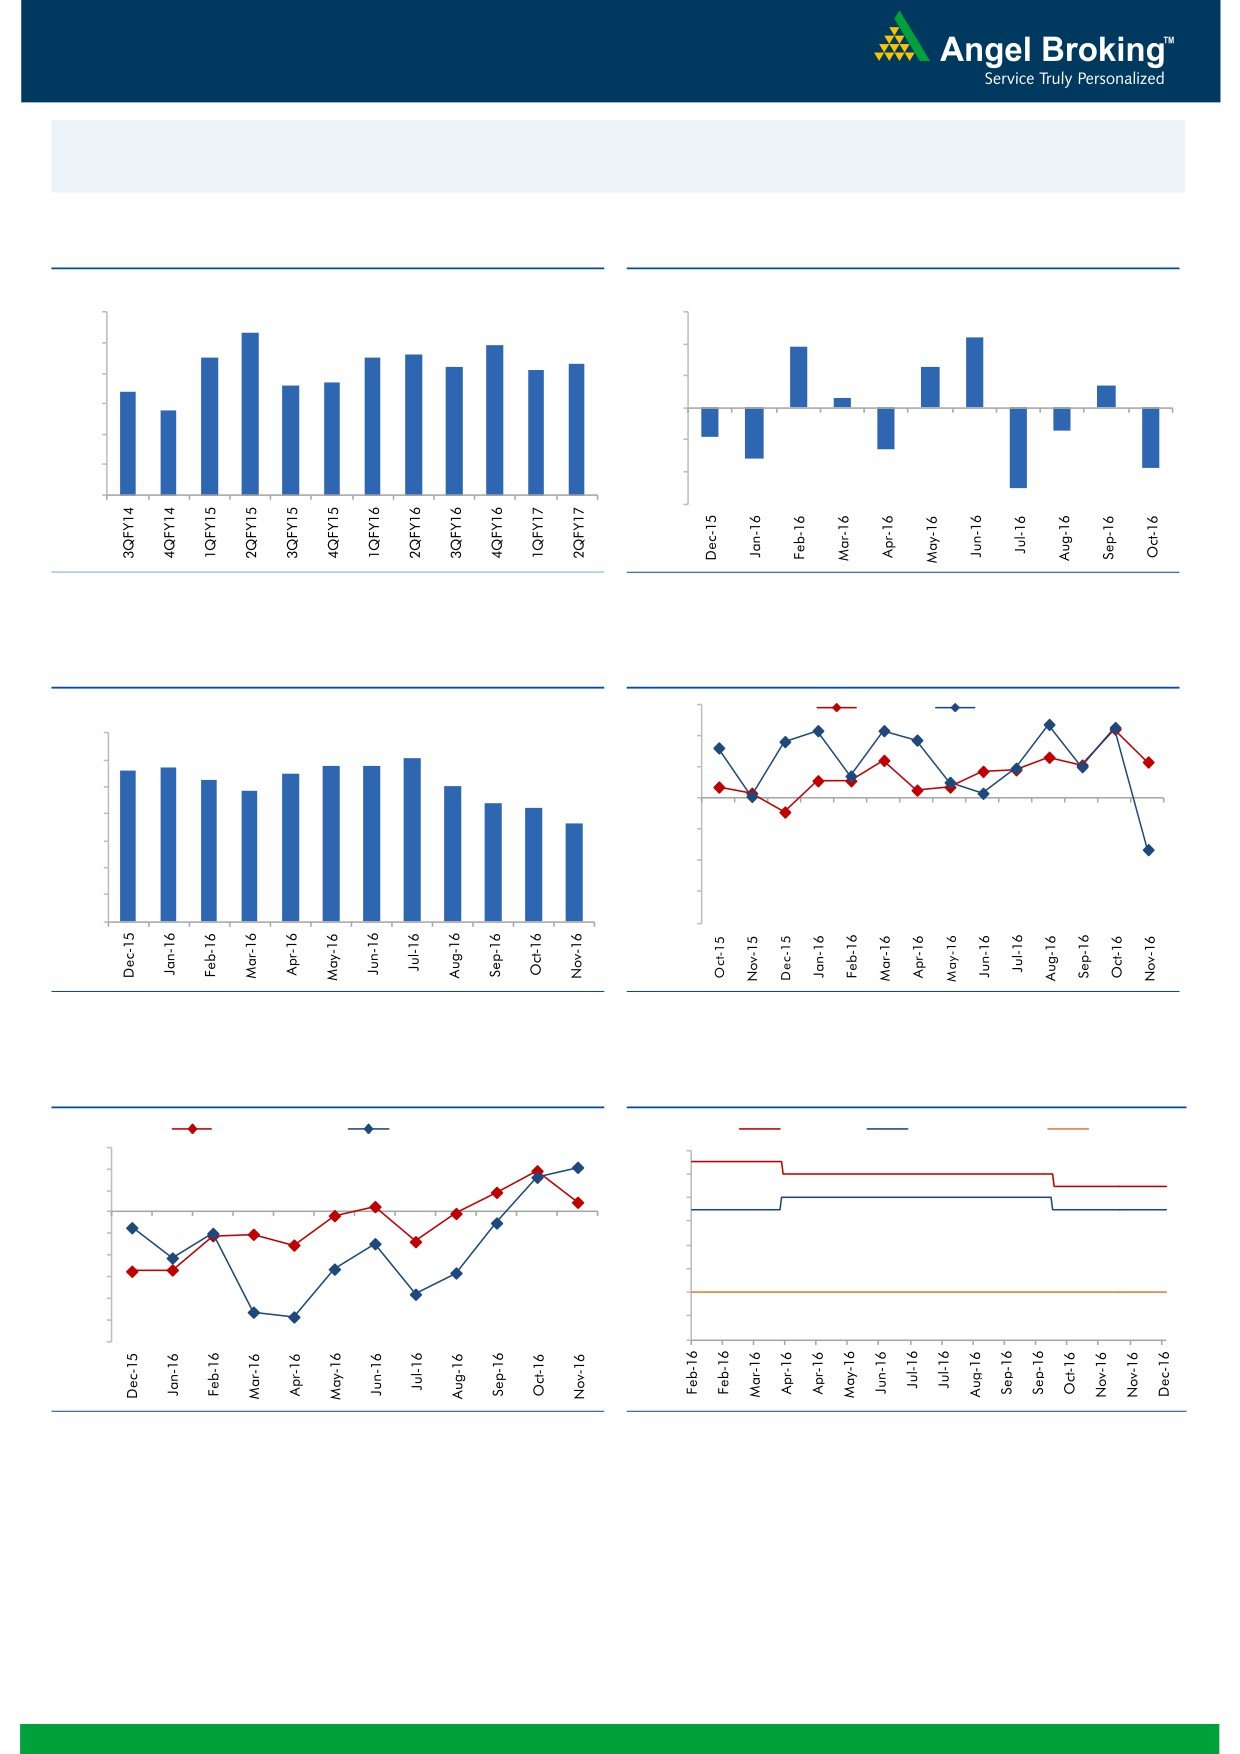
Macro watch
Exhibit 1: Quarterly GDP trends
Exhibit 2: IIP trends
(%)
(%)
9.0
3.0
8.3
2.2
7.9
1.9
7.5
7.5
7.6
8.0
7.3
2.0
7.2
7.1
1.3
6.6
6.7
0.7
7.0
6.4
1.0
0.3
5.8
6.0
-
5.0
(1.0)
(0.7)
(0.9)
4.0
(1.3)
(2.0)
(1.6)
(1.9)
3.0
(3.0)
(2.5)
Source: CSO, Angel Research
Source: MOSPI, Angel Research
Exhibit 3: Monthly CPI inflation trends
Exhibit 4: Manufacturing and services PMI
56.0
Mfg. PMI
Services PMI
(%)
7.0
54.0
6.1
5.6
5.7
5.8
5.8
6.0
5.3
5.5
5.1
52.0
4.8
5.0
4.4
4.2
50.0
3.6
4.0
48.0
3.0
46.0
2.0
1.0
44.0
-
42.0
Source: MOSPI, Angel Research
Source: Market, Angel Research; Note: Level above 50 indicates expansion
Exhibit 5: Exports and imports growth trends
Exhibit 6: Key policy rates
(%)
Exports yoy growth
Imports yoy growth
(%)
Repo rate
Reverse Repo rate
CRR
15.0
7.00
10.0
6.50
5.0
6.00
0.0
5.50
(5.0)
5.00
(10.0)
4.50
(15.0)
(20.0)
4.00
(25.0)
3.50
(30.0)
3.00
Source: Bloomberg, Angel Research
Source: RBI, Angel Research
Market Outlook
December 26, 2016
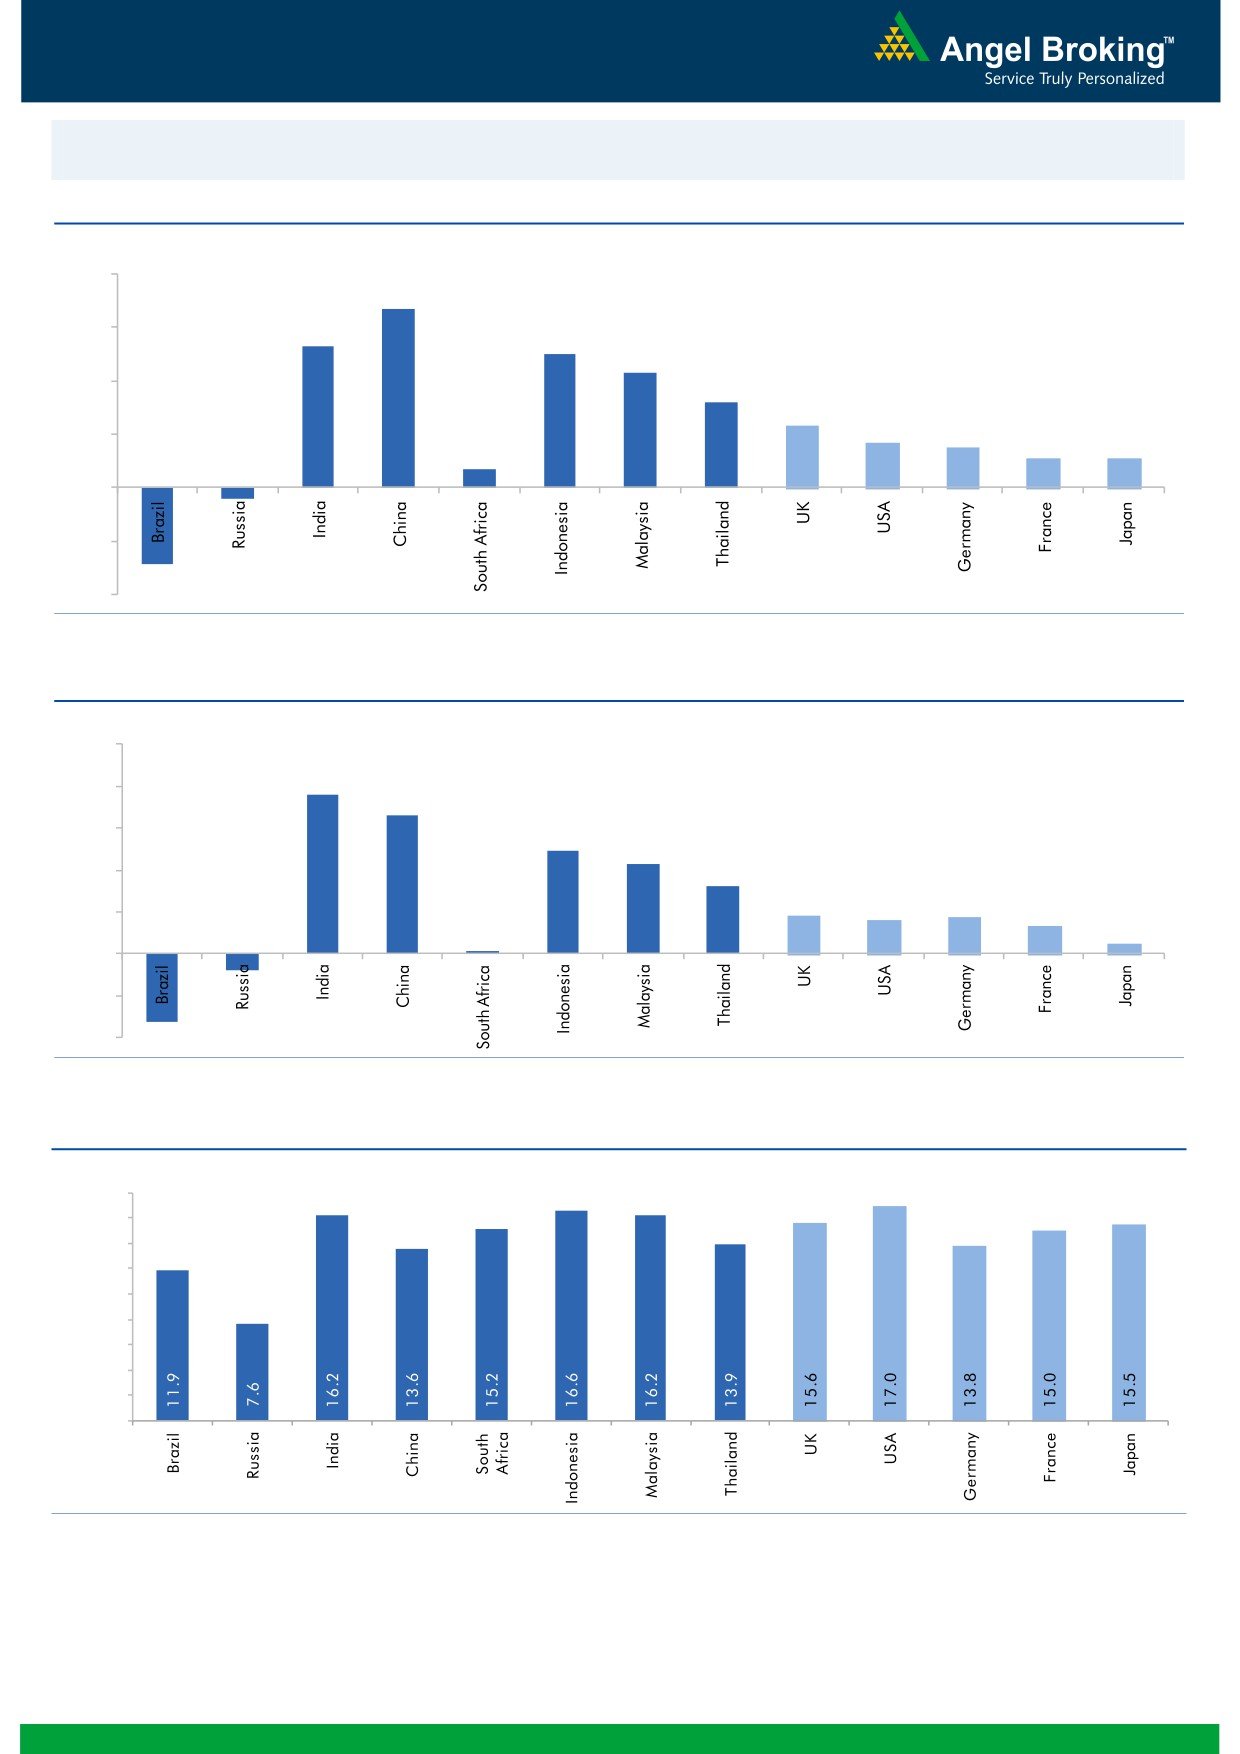
Global watch
Exhibit 1: Latest quarterly GDP Growth (%, yoy) across select developing and developed countries
(%)
8.0
6.7
5.3
6.0
5.0
0.7
4.3
4.0
3.2
2.3
1.7
1.5
2.0
1.1
1.1
-
(2.0)
(0.4)
(2.9)
(4.0)
Source: Bloomberg, Angel Research
Exhibit 2: 2016 GDP Growth projection by IMF (%, yoy) across select developing and developed countries
(%)
10.0
7.6
8.0
6.6
6.0
4.9
4.3
4.0
3.2
1.8
1.7
1.6
1.3
2.0
(0.8)
0.5
(3.3)
0.1
-
(2.0)
(4.0)
Source: IMF, Angel Research
Exhibit 3: One year forward P-E ratio across select developing and developed countries
(x)
18.0
16.0
14.0
12.0
10.0
8.0
6.0
4.0
2.0
-
Source: IMF, Angel Research (*valuation ratios as of December, 23, 2016)
Market Outlook
December 26, 2016
Exhibit 4: Relative performance of indices across globe
Returns (%)
Country
Name of index
Closing price
1M
3M
1YR
Brazil
Bovespa
57,937
-6.50
0.38
28.01
Russia
Micex
2,173
5.11
7.31
26.09
India
Nifty
7,986
-0.22
-9.02
2.99
China
Shanghai Composite
3,110
-4.32
2.52
-11.65
South Africa
Top 40
42,861
-2.96
-5.43
-4.54
Mexico
Mexbol
45,174
1.87
-2.54
3.68
Indonesia
LQ45
833
-3.25
-10.35
11.46
Malaysia
KLCI
1,623
-0.29
-2.09
0.01
Thailand
SET 50
943
2.76
0.45
15.11
USA
Dow Jones
19,934
5.18
8.38
13.58
UK
FTSE
7,068
3.66
2.26
11.96
Japan
Nikkei
19,428
7.30
17.60
2.90
Germany
DAX
11,450
6.84
7.24
5.44
France
CAC
4,840
6.40
7.80
7.00
Source: Bloomberg, Angel Research
Stock Watch
December 26, 2016
Company Name
Reco
CMP
Target
Mkt Cap
Sales ( Čcr )
OPM(%)
EPS (Č)
PER(x)
P/BV(x)
RoE(%)
EV/Sales(x)
(Č)
Price ( Č)
( Č cr )
FY17E FY18E
FY17E
FY18E
FY17E
FY18E
FY17E
FY18E
FY17E
FY18E
FY17E
FY18E
FY17E
FY18E
Agri / Agri Chemical
Rallis
Accumulate
194
209
3,763
1,937
2,164
13.3
14.3
9.0
11.0
21.5
17.6
3.7
3.3
18.4
19.8
2.0
1.7
United Phosphorus
Accumulate
629
684
31,862
15,176
17,604
18.5
18.5
37.4
44.6
16.8
14.1
3.3
2.7
21.4
21.2
2.2
1.9
Auto & Auto Ancillary
Ashok Leyland
Buy
78
111
22,112
22,407
26,022
10.6
10.6
5.2
6.4
14.9
12.1
3.4
2.8
23.6
24.7
1.1
0.9
Bajaj Auto
Neutral
2,621
-
75,853
25,093
27,891
19.5
19.2
143.9
162.5
18.2
16.1
5.1
4.4
30.3
29.4
2.8
2.4
Bharat Forge
Neutral
911
-
21,218
7,726
8,713
20.5
21.2
35.3
42.7
25.8
21.4
4.8
4.3
18.9
20.1
2.8
2.4
Eicher Motors
Neutral
20,922
-
56,915
16,583
20,447
17.5
18.0
598.0
745.2
35.0
28.1
12.0
9.1
41.2
38.3
3.3
2.6
Gabriel India
Buy
107
130
1,539
1,544
1,715
9.0
9.3
5.4
6.3
19.8
17.0
3.8
3.3
18.9
19.5
1.0
0.8
Hero Motocorp
Buy
3,036
3,541
60,626
30,958
34,139
15.7
15.7
193.6
208.3
15.7
14.6
6.1
5.1
34.2
30.5
1.8
1.6
Jamna Auto Industries Neutral
160
-
1,276
1,486
1,620
9.8
9.9
15.0
17.2
10.7
9.3
2.3
2.0
21.8
21.3
0.9
0.8
L G Balakrishnan & Bros Neutral
541
-
850
1,302
1,432
11.6
11.9
43.7
53.0
12.4
10.2
1.8
1.6
13.8
14.2
0.7
0.7
Mahindra and Mahindra Neutral
1,172
-
72,777
46,534
53,077
11.6
11.7
67.3
78.1
17.4
15.0
2.8
2.5
15.4
15.8
1.5
1.3
Maruti
Buy
5,193
6,006
156,878
68,057
82,958
15.8
15.5
212.1
261.2
24.5
19.9
4.9
4.0
19.8
20.3
2.0
1.6
Minda Industries
Neutral
305
-
2,419
2,728
3,042
9.0
9.1
68.2
86.2
4.5
3.5
1.0
0.8
23.8
24.3
0.9
0.8
Motherson Sumi
Neutral
310
-
43,470
45,896
53,687
7.8
8.3
13.0
16.1
23.8
19.2
7.7
6.1
34.7
35.4
1.0
0.9
Rane Brake Lining
Neutral
948
-
751
511
562
11.3
11.5
28.1
30.9
33.8
30.7
5.2
4.7
15.3
15.0
1.6
1.5
Setco Automotive
Neutral
36
-
479
741
837
13.0
13.0
15.2
17.0
2.4
2.1
0.4
0.4
15.8
16.3
1.0
0.9
Tata Motors
Neutral
466
-
134,587
300,209
338,549
8.9
8.4
42.7
54.3
10.9
8.6
1.8
1.5
15.6
17.2
0.6
0.5
TVS Motor
Neutral
370
-
17,595
13,390
15,948
6.9
7.1
12.8
16.5
29.0
22.4
7.2
5.7
26.3
27.2
1.4
1.1
Amara Raja Batteries
Buy
886
1,167
15,135
5,504
6,605
17.6
17.5
33.4
40.9
26.5
21.7
5.9
4.8
22.1
22.0
2.7
2.3
Exide Industries
Neutral
173
-
14,722
7,439
8,307
15.0
15.0
8.1
9.3
21.4
18.6
3.0
2.7
14.3
16.7
1.6
1.4
Apollo Tyres
Buy
190
235
9,654
12,877
14,504
14.3
13.9
21.4
23.0
8.9
8.3
1.4
1.2
16.4
15.2
0.9
0.9
Ceat
Buy
1,143
1,450
4,623
7,524
8,624
13.0
12.7
131.1
144.3
8.7
7.9
1.6
1.4
19.8
18.6
0.7
0.6
JK Tyres
Neutral
111
-
2,515
7,455
8,056
15.0
15.0
21.8
24.5
5.1
4.5
1.1
0.9
22.8
21.3
0.5
0.4
Swaraj Engines
Neutral
1,336
-
1,659
660
810
15.2
16.4
54.5
72.8
24.5
18.4
7.6
6.9
31.5
39.2
2.3
1.9
Subros
Neutral
155
-
929
1,488
1,681
11.7
11.9
6.4
7.2
24.2
21.6
2.6
2.3
10.8
11.4
0.9
0.7
Indag Rubber
Neutral
180
-
474
286
326
19.8
16.8
11.7
13.3
15.4
13.5
2.6
2.4
17.8
17.1
1.3
1.2
Capital Goods
ACE
Neutral
45
-
446
709
814
4.1
4.6
1.4
2.1
32.2
21.5
1.3
1.3
4.4
6.0
0.8
0.7
BEML
Neutral
970
-
4,040
3,451
4,055
6.3
9.2
31.4
57.9
30.9
16.8
1.9
1.7
6.3
10.9
1.3
1.1
Bharat Electronics
Neutral
1,385
-
30,935
8,137
9,169
16.8
17.2
58.7
62.5
23.6
22.2
3.7
3.3
44.6
46.3
2.8
2.5
Stock Watch
December 26, 2016
Company Name
Reco
CMP
Target
Mkt Cap
Sales ( Čcr )
OPM(%)
EPS (Č)
PER(x)
P/BV(x)
RoE(%)
EV/Sales(x)
(Č)
Price ( Č)
( Č cr )
FY17E
FY18E
FY17E
FY18E
FY17E
FY18E
FY17E
FY18E
FY17E
FY18E
FY17E
FY18E
FY17E
FY18E
Capital Goods
Voltas
Buy
315
407
10,438
6,511
7,514
7.9
8.7
12.9
16.3
24.5
19.4
4.4
3.9
16.7
18.5
1.4
1.1
BGR Energy
Neutral
111
-
798
16,567
33,848
6.0
5.6
7.8
5.9
14.2
18.8
0.8
0.8
4.7
4.2
0.2
0.1
BHEL
Neutral
119
-
29,151
28,797
34,742
-
2.8
2.3
6.9
51.8
17.3
0.9
0.9
1.3
4.8
0.7
0.4
Blue Star
Buy
448
634
4,282
4,283
5,077
5.9
7.3
14.9
22.1
30.1
20.3
5.8
4.9
20.4
26.4
1.0
0.9
Crompton Greaves
Neutral
58
-
3,610
5,777
6,120
5.9
7.0
3.3
4.5
17.5
12.8
0.8
0.7
4.4
5.9
0.6
0.5
Greaves Cotton
Neutral
120
-
2,923
1,755
1,881
16.8
16.9
7.8
8.5
15.4
14.1
3.1
2.9
20.6
20.9
1.4
1.2
Inox Wind
Neutral
185
-
4,107
5,605
6,267
15.7
16.4
24.8
30.0
7.5
6.2
2.1
1.5
25.9
24.4
0.8
0.6
KEC International
Neutral
135
-
3,462
9,294
10,186
7.9
8.1
9.9
11.9
13.6
11.3
2.0
1.7
15.6
16.3
0.6
0.5
Thermax
Neutral
773
-
9,213
5,421
5,940
7.3
7.3
25.7
30.2
30.1
25.6
3.6
3.3
12.2
13.1
1.6
1.5
VATech Wabag
Buy
453
681
2,471
3,136
3,845
8.9
9.1
26.0
35.9
17.4
12.6
2.2
1.9
13.4
15.9
0.7
0.5
Cement
ACC
Neutral
1,296
-
24,340
11,225
13,172
13.2
16.9
44.5
75.5
29.1
17.2
2.8
2.5
11.2
14.2
2.2
1.9
Ambuja Cements
Neutral
200
-
39,743
9,350
10,979
18.2
22.5
5.8
9.5
34.5
21.1
2.9
2.6
10.2
12.5
4.3
3.6
India Cements
Neutral
112
-
3,445
4,364
4,997
18.5
19.2
7.9
11.3
14.2
9.9
1.0
1.0
8.0
8.5
1.6
1.4
JK Cement
Neutral
650
-
4,543
4,398
5,173
15.5
17.5
31.2
55.5
20.8
11.7
2.5
2.2
12.0
15.5
1.6
1.3
J K Lakshmi Cement
Buy
339
565
3,990
2,913
3,412
14.5
19.5
7.5
22.5
45.2
15.1
2.8
2.3
12.5
18.0
2.0
1.6
Orient Cement
Buy
120
215
2,449
2,114
2,558
18.5
20.5
8.1
11.3
14.8
10.6
2.2
1.8
9.0
14.0
1.8
1.4
UltraTech Cement
Neutral
3,106
-
85,242
25,768
30,385
21.0
23.5
111.0
160.0
28.0
19.4
3.6
3.1
13.5
15.8
3.4
2.8
Construction
ITNL
Neutral
101
-
3,324
8,946
10,017
31.0
31.6
8.1
9.1
12.5
11.1
0.5
0.5
4.2
5.0
3.7
3.4
KNR Constructions
Buy
156
802
2,187
1,385
1,673
14.7
14.0
41.2
48.5
3.8
3.2
0.7
0.6
14.9
15.2
1.7
1.4
Larsen & Toubro
Buy
1,337
1,634
124,694
111,017
124,908
11.0
11.0
61.1
66.7
21.9
20.0
2.6
2.4
13.1
12.9
2.2
2.0
Gujarat Pipavav Port
Neutral
130
-
6,270
705
788
52.2
51.7
5.0
5.6
25.9
23.2
2.6
2.3
11.2
11.2
8.5
7.2
Nagarjuna Const.
Neutral
78
-
4,336
8,842
9,775
9.1
8.8
5.3
6.4
14.7
12.2
1.2
1.1
8.2
9.1
0.7
0.6
PNC Infratech
Buy
104
143
2,659
2,350
2,904
13.1
13.2
9.0
8.8
11.5
11.8
0.4
0.4
15.9
13.9
1.3
1.0
Simplex Infra
Neutral
276
-
1,365
6,829
7,954
10.5
10.5
31.4
37.4
8.8
7.4
0.9
0.8
9.9
13.4
0.6
0.5
Power Mech Projects
Neutral
446
-
656
1,801
2,219
12.7
14.6
72.1
113.9
6.2
3.9
1.1
1.0
16.8
11.9
0.4
0.3
Sadbhav Engineering
Accumulate
260
298
4,456
3,598
4,140
10.3
10.6
9.0
11.9
28.9
21.8
3.0
2.7
9.9
11.9
1.5
1.3
NBCC
Neutral
223
-
13,395
7,428
9,549
7.9
8.6
8.2
11.0
27.2
20.3
1.4
1.1
28.2
28.7
1.5
1.1
MEP Infra
Neutral
36
-
583
1,877
1,943
30.6
29.8
3.0
4.2
12.0
8.5
5.8
3.9
0.6
0.6
1.7
1.5
SIPL
Neutral
93
-
3,288
1,036
1,252
65.5
66.2
(8.4)
(5.6)
3.5
4.0
(22.8)
(15.9)
11.4
9.5
Stock Watch
December 26, 2016
Company Name
Reco
CMP
Target
Mkt Cap
Sales ( Čcr )
OPM(%)
EPS (Č)
PER(x)
P/BV(x)
RoE(%)
EV/Sales(x)
(Č)
Price ( Č)
( Č cr )
FY17E
FY18E
FY17E
FY18E
FY17E
FY18E
FY17E
FY18E
FY17E
FY18E
FY17E
FY18E
FY17E
FY18E
Construction
Engineers India
Neutral
324
-
10,900
1,725
1,935
16.0
19.1
11.4
13.9
28.4
23.3
3.9
3.8
13.4
15.3
5.2
4.7
Financials
Axis Bank
Buy
438
630
104,846
46,932
53,575
3.5
3.4
32.4
44.6
13.6
9.8
1.7
1.5
13.6
16.5
-
-
Bank of Baroda
Neutral
153
-
35,242
19,980
23,178
1.8
1.8
11.5
17.3
13.3
8.8
1.5
1.3
8.3
10.1
-
-
Canara Bank
Neutral
280
-
15,182
15,225
16,836
1.8
1.8
14.5
28.0
19.3
10.0
1.3
1.1
5.8
8.5
-
-
Dewan Housing Finance Buy
234
350
7,324
2,225
2,688
2.9
2.9
29.7
34.6
7.9
6.8
1.3
1.1
16.1
16.8
-
-
Equitas Holdings
Buy
143
235
4,796
939
1,281
11.7
11.5
5.8
8.2
24.7
17.4
2.1
1.9
10.9
11.5
-
-
Federal Bank
Neutral
65
-
11,193
9,353
10,623
2.9
2.9
4.4
5.8
14.8
11.2
1.4
1.3
9.5
11.0
-
-
HDFC
Neutral
1,225
-
194,182
11,475
13,450
3.4
3.4
45.3
52.5
27.1
23.3
5.2
4.6
20.2
20.5
-
-
HDFC Bank
Accumulate
1,186
1,350
302,900
46,097
55,433
4.5
4.5
58.4
68.0
20.3
17.5
3.6
3.0
18.8
18.6
-
-
ICICI Bank
Buy
252
315
146,648
42,800
44,686
3.1
3.3
18.0
21.9
14.0
11.5
1.9
1.8
11.1
12.3
-
-
Lakshmi Vilas Bank
Buy
142
174
2,540
3,339
3,799
2.7
2.8
11.0
14.0
12.9
10.1
1.3
1.2
11.2
12.7
-
-
LIC Housing Finance
Buy
542
630
27,358
3,712
4,293
2.6
2.5
39.0
46.0
13.9
11.8
2.6
2.2
19.9
20.1
-
-
Punjab Natl.Bank
Neutral
120
-
25,525
23,532
23,595
2.3
2.4
6.8
12.6
17.6
9.5
2.7
1.9
3.3
6.5
-
-
RBL Bank
Neutral
337
-
12,448
1,783
2,309
2.6
2.6
12.7
16.4
26.5
20.5
2.9
2.6
12.8
13.3
-
-
South Ind.Bank
Neutral
20
-
2,717
6,435
7,578
2.5
2.5
2.7
3.1
7.4
6.5
1.0
0.8
10.1
11.2
-
-
St Bk of India
Neutral
249
-
193,487
88,650
98,335
2.6
2.6
13.5
18.8
18.5
13.3
1.8
1.5
7.0
8.5
-
-
Union Bank
Neutral
126
-
8,679
13,450
14,925
2.3
2.3
25.5
34.5
5.0
3.7
0.7
0.6
7.5
10.2
-
-
Yes Bank
Neutral
1,125
-
47,565
8,978
11,281
3.3
3.4
74.0
90.0
15.2
12.5
2.9
2.4
17.0
17.2
-
-
FMCG
Asian Paints
Neutral
874
-
83,810
17,128
18,978
16.8
16.4
19.1
20.7
45.8
42.2
15.9
15.0
34.8
35.5
4.8
4.3
Britannia
Buy
2,825
3,626
33,895
9,594
11,011
14.6
14.9
80.3
94.0
35.2
30.1
14.5
11.2
41.2
-
3.4
2.9
Colgate
Accumulate
903
995
24,566
4,605
5,149
23.4
23.4
23.8
26.9
38.0
33.6
21.0
16.4
64.8
66.8
5.3
4.7
Dabur India
Buy
263
304
46,240
8,315
9,405
19.8
20.7
8.1
9.2
32.4
28.5
9.0
7.5
31.6
31.0
5.2
4.6
GlaxoSmith Con*
Neutral
4,957
-
20,846
4,350
4,823
21.2
21.4
179.2
196.5
27.7
25.2
7.4
6.2
27.1
26.8
4.2
3.7
Godrej Consumer
Neutral
1,432
-
48,776
10,235
11,428
18.4
18.6
41.1
44.2
34.8
32.4
7.7
6.5
24.9
24.8
4.8
4.3
HUL
Neutral
791
-
171,183
35,252
38,495
17.8
17.8
20.7
22.4
38.3
35.3
36.6
31.4
95.6
88.9
4.7
4.3
ITC
Buy
225
284
272,444
40,059
44,439
38.3
39.2
9.0
10.1
25.0
22.2
7.0
6.1
27.8
27.5
6.3
5.7
Marico
Buy
246
300
31,760
6,430
7,349
18.8
19.5
6.4
7.7
38.5
32.0
11.6
9.8
33.2
32.5
4.8
4.1
Nestle*
Neutral
5,827
-
56,179
10,073
11,807
20.7
21.5
124.8
154.2
46.7
37.8
19.2
17.2
34.8
36.7
5.4
4.6
Tata Global
Neutral
119
-
7,501
8,675
9,088
9.8
9.8
7.4
8.2
16.1
14.5
1.8
1.8
7.9
8.1
0.8
0.7
Stock Watch
December 26, 2016
Company Name
Reco
CMP
Target
Mkt Cap
Sales ( Čcr )
OPM(%)
EPS (Č)
PER(x)
P/BV(x)
RoE(%)
EV/Sales(x)
(Č)
Price ( Č)
( Č cr )
FY17E FY18E
FY17E
FY18E
FY17E
FY18E
FY17E
FY18E
FY17E
FY18E
FY17E
FY18E
FY17E
FY18E
FMCG
Procter & Gamble
Accumulate
6,622
7,369
21,495
2,939
3,342
23.2
23.0
146.2
163.7
45.3
40.5
101.4
97.2
25.3
23.5
6.9
6.0
Hygiene
IT
HCL Tech^
Buy
794
1,000
112,060
49,242
57,168
20.5
20.5
55.7
64.1
14.3
12.4
2.9
2.2
20.3
17.9
2.1
1.7
Infosys
Buy
989
1,249
227,237
68,350
77,326
27.0
27.0
62.5
69.4
15.8
14.3
3.4
3.1
21.3
21.6
2.8
2.4
TCS
Accumulate
2,290
2,620
451,267
119,025
133,308
27.6
27.6
131.2
145.5
17.5
15.7
5.7
5.2
32.4
33.1
3.6
3.1
Tech Mahindra
Buy
467
600
45,451
29,673
32,937
15.5
17.0
32.8
39.9
14.2
11.7
2.8
2.4
19.6
20.7
1.3
1.1
Wipro
Buy
459
590
111,565
55,440
60,430
18.1
18.1
35.9
39.9
12.8
11.5
2.3
2.1
19.0
19.3
1.7
1.6
Media
D B Corp
Neutral
351
-
6,450
2,297
2,590
27.4
28.2
21.0
23.4
16.7
15.0
3.9
3.4
23.7
23.1
2.6
2.2
HT Media
Neutral
73
-
1,707
2,693
2,991
12.6
12.9
7.9
9.0
9.3
8.2
0.8
0.7
7.8
8.3
0.2
0.1
Jagran Prakashan
Buy
168
225
5,500
2,355
2,635
28.0
28.0
10.8
12.5
15.6
13.5
3.4
2.9
21.7
21.7
2.4
2.1
Sun TV Network
Neutral
490
-
19,304
2,850
3,265
70.1
71.0
26.2
30.4
18.7
16.1
4.8
4.2
24.3
25.6
6.4
5.4
Hindustan Media
Neutral
268
-
1,965
1,016
1,138
24.3
25.2
27.3
30.1
9.8
8.9
1.9
1.7
16.2
15.8
1.3
1.1
Ventures
TV Today Network
Buy
259
385
1,546
637
743
27.5
27.5
18.4
21.4
14.1
12.1
2.5
2.1
17.4
17.2
2.0
1.6
Metals & Mining
Coal India
Neutral
288
-
178,835
84,638
94,297
21.4
22.3
24.5
27.1
11.8
10.6
4.9
4.7
42.6
46.0
1.6
1.5
Hind. Zinc
Neutral
258
-
108,929
14,252
18,465
55.9
48.3
15.8
21.5
16.3
12.0
2.7
2.3
17.0
20.7
7.6
5.9
Hindalco
Neutral
159
-
32,934
107,899
112,095
7.4
8.2
9.2
13.0
17.3
12.3
0.8
0.8
4.8
6.6
0.8
0.8
JSW Steel
Neutral
1,569
-
37,918
53,201
58,779
16.1
16.2
130.6
153.7
12.0
10.2
1.6
1.4
14.0
14.4
1.5
1.3
NMDC
Neutral
123
-
39,011
6,643
7,284
44.4
47.7
7.1
7.7
17.4
16.0
1.5
1.5
8.8
9.2
3.6
3.3
SAIL
Neutral
50
-
20,444
47,528
53,738
(0.7)
2.1
(1.9)
2.6
19.0
0.5
0.5
(1.6)
3.9
1.3
1.2
Vedanta
Neutral
217
-
64,230
71,744
81,944
19.2
21.7
13.4
20.1
16.2
10.8
1.4
1.2
8.4
11.3
1.3
1.0
Tata Steel
Neutral
391
-
37,950
121,374
121,856
7.2
8.4
18.6
34.3
21.0
11.4
1.3
1.2
6.1
10.1
1.0
0.9
Oil & Gas
Cairn India
Neutral
244
-
45,705
9,127
10,632
4.3
20.6
8.8
11.7
27.7
20.8
0.9
0.9
3.3
4.2
6.5
5.4
GAIL
Neutral
432
-
54,747
56,220
65,198
9.3
10.1
27.1
33.3
15.9
13.0
1.5
1.4
9.3
10.7
1.2
1.0
ONGC
Neutral
193
-
247,681
137,222
152,563
15.0
21.8
19.5
24.1
9.9
8.0
0.9
0.8
8.5
10.1
2.1
1.9
Indian Oil Corp
Neutral
313
-
152,111
373,359
428,656
5.9
5.5
54.0
59.3
5.8
5.3
0.9
0.8
16.0
15.6
0.6
0.5
Reliance Industries
Neutral
1,058
-
343,221
301,963
358,039
12.1
12.6
87.7
101.7
12.1
10.4
1.2
1.1
10.7
11.3
1.6
1.3
Pharmaceuticals
Alembic Pharma
Neutral
610
-
11,505
3,483
4,083
20.2
21.4
24.3
30.4
25.1
20.1
5.7
4.6
25.5
25.3
3.2
2.7
Alkem Laboratories Ltd
Buy
1,601
1,989
19,145
6,043
6,893
18.7
19.3
80.5
88.8
19.9
18.0
4.4
3.7
22.3
20.3
3.1
2.7
Aurobindo Pharma
Buy
648
877
37,910
15,720
18,078
23.7
23.7
41.4
47.3
15.7
13.7
4.1
3.2
29.6
26.1
2.6
2.3
Sanofi India*
Neutral
4,236
-
9,757
2,277
2,597
17.3
18.3
149.4
172.0
28.4
24.6
4.7
3.8
25.1
28.8
4.0
3.2
Stock Watch
December 26, 2016
Company Name
Reco
CMP
Target
Mkt Cap
Sales ( Čcr )
OPM(%)
EPS (Č)
PER(x)
P/BV(x)
RoE(%)
EV/Sales(x)
(Č)
Price ( Č)
( Č cr )
FY17E FY18E
FY17E
FY18E
FY17E
FY18E
FY17E
FY18E
FY17E
FY18E
FY17E
FY18E
FY17E
FY18E
Pharmaceuticals
Cadila Healthcare
Buy
338
400
34,582
10,429
12,318
22.6
22.0
16.9
19.2
20.0
17.6
5.1
4.1
28.5
25.7
3.3
2.7
Cipla
Sell
583
490
46,869
15,378
18,089
17.4
18.4
21.6
27.2
27.0
21.4
3.5
3.0
13.7
15.2
3.3
2.7
Dr Reddy's
Neutral
3,003
-
49,752
16,043
18,119
20.8
22.4
112.4
142.9
26.7
21.0
3.6
3.1
14.1
15.9
3.1
2.7
Dishman Pharma
Neutral
211
-
3,401
1,718
1,890
22.7
22.8
9.5
11.3
22.2
18.7
2.1
1.9
10.1
10.9
2.4
2.1
GSK Pharma*
Neutral
2,718
-
23,026
3,000
3,312
15.4
20.6
46.5
60.8
58.5
44.7
14.0
14.0
26.3
30.6
7.4
6.8
Indoco Remedies
Reduce
257
240
2,371
1,112
1,289
16.2
18.2
11.6
16.0
22.2
16.1
3.5
3.0
17.0
20.1
2.3
1.9
Ipca labs
Buy
528
613
6,656
3,303
3,799
15.3
15.3
17.3
19.7
30.5
26.8
2.7
2.4
9.1
9.4
2.1
1.9
Lupin
Buy
1,445
1,809
65,244
15,912
18,644
26.4
26.7
58.1
69.3
24.9
20.9
4.8
4.0
21.4
20.9
4.2
3.4
Sun Pharma
Buy
624
847
149,663
31,129
35,258
32.0
32.9
30.2
35.3
20.7
17.7
3.4
2.8
20.0
20.1
4.4
3.7
Power
Tata Power
Neutral
74
-
20,001
36,916
39,557
17.4
27.1
5.1
6.3
14.5
11.7
1.3
1.2
9.0
10.3
1.6
1.4
NTPC
Neutral
161
-
132,876
86,605
95,545
17.5
20.8
11.8
13.4
13.7
12.0
1.4
1.3
10.5
11.1
2.9
2.9
Power Grid
Buy
182
223
95,424
25,315
29,193
88.2
88.7
14.2
17.2
12.9
10.6
2.0
1.7
15.2
16.1
8.4
7.6
Real Estate
MLIFE
Buy
353
522
1,449
1,152
1,300
22.7
24.6
29.9
35.8
11.8
9.9
0.9
0.8
7.6
8.6
2.0
1.6
Telecom
Bharti Airtel
Neutral
296
-
118,123
105,086
114,808
34.5
34.7
12.2
16.4
24.2
18.0
1.6
1.5
6.8
8.4
2.0
1.8
Idea Cellular
Neutral
71
-
25,497
40,133
43,731
37.2
37.1
6.4
6.5
11.1
10.9
0.9
0.9
8.2
7.6
1.7
1.4
zOthers
Abbott India
Neutral
4,673
-
9,929
3,153
3,583
14.1
14.4
152.2
182.7
30.7
25.6
150.7
128.7
25.6
26.1
2.9
2.5
Bajaj Electricals
Buy
212
274
2,144
4,801
5,351
5.7
6.2
10.4
13.7
20.3
15.5
2.5
2.2
12.4
14.5
0.4
0.4
Finolex Cables
Neutral
404
-
6,185
2,883
3,115
12.0
12.1
14.2
18.6
28.5
21.7
15.2
13.2
15.8
14.6
1.8
1.7
Goodyear India*
Neutral
657
-
1,516
1,598
1,704
10.4
10.2
49.4
52.6
13.3
12.5
61.4
53.9
18.2
17.0
0.6
86.8
Hitachi
Neutral
1,403
-
3,816
2,081
2,433
8.8
8.9
33.4
39.9
42.0
35.2
33.9
28.3
22.1
21.4
1.8
1.5
Jyothy Laboratories
Neutral
328
-
5,951
1,440
2,052
11.5
13.0
8.5
10.0
38.6
32.8
9.3
8.6
18.6
19.3
4.4
3.1
Page Industries
Neutral
13,504
-
15,062
2,450
3,124
20.1
17.6
299.0
310.0
45.2
43.6
300.8
229.6
47.1
87.5
6.2
4.9
Relaxo Footwears
Neutral
399
-
4,787
2,085
2,469
9.2
8.2
7.6
8.0
52.7
50.1
20.4
17.5
17.9
18.8
2.4
2.0
Siyaram Silk Mills
Accumulate
1,207
1,605
1,132
1,733
1,948
11.6
11.7
96.6
114.7
12.5
10.5
1.9
1.7
15.3
15.7
0.9
0.8
Styrolution ABS India*
Neutral
580
-
1,020
1,440
1,537
9.2
9.0
40.6
42.6
14.3
13.6
36.5
33.2
12.3
11.6
0.7
0.6
TVS Srichakra
Neutral
3,223
-
2,468
2,304
2,614
13.7
13.8
231.1
266.6
13.9
12.1
362.1
285.1
33.9
29.3
1.1
0.9
HSIL
Neutral
281
-
2,029
2,384
2,515
15.8
16.3
15.3
19.4
18.3
14.5
18.2
15.7
7.8
9.3
1.0
0.9
Kirloskar Engines India
Neutral
325
-
4,702
2,554
2,800
9.9
10.0
10.5
12.1
31.0
26.9
13.0
12.2
10.7
11.7
1.5
1.3
Ltd
M M Forgings
Neutral
430
-
519
546
608
20.4
20.7
41.3
48.7
10.4
8.8
58.9
52.1
16.6
17.0
0.8
0.7
Stock Watch
December 26, 2016
Company Name
Reco
CMP
Target
Mkt Cap
Sales ( Čcr )
OPM(%)
EPS (Č)
PER(x)
P/BV(x)
RoE(%)
EV/Sales(x)
(Č)
Price ( Č)
( Č cr )
FY17E
FY18E
FY17E
FY18E
FY17E
FY18E
FY17E
FY18E
FY17E
FY18E
FY17E
FY18E
FY17E
FY18E
zOthers
Banco Products (India) Neutral
176
-
1,262
1,353
1,471
12.3
12.4
14.5
16.3
12.2
10.8
16.8
15.1
14.5
14.6
0.9
93.2
Competent Automobiles Neutral
160
-
98
1,137
1,256
3.1
2.7
28.0
23.6
5.7
6.8
30.8
27.8
14.3
11.5
0.1
0.1
Nilkamal
Neutral
1,262
-
1,884
1,995
2,165
10.7
10.4
69.8
80.6
18.1
15.7
72.1
62.7
16.6
16.5
0.9
0.8
Visaka Industries
Neutral
181
-
288
1,051
1,138
10.3
10.4
21.0
23.1
8.6
7.8
23.3
21.8
9.0
9.2
0.5
0.5
Transport Corporation of
Neutral
150
-
1,152
2,671
2,911
8.5
8.8
13.9
15.7
10.9
9.6
1.5
1.3
13.7
13.8
0.5
0.5
India
Elecon Engineering
Neutral
56
-
627
1,482
1,660
13.7
14.5
3.9
5.8
14.3
9.6
3.4
3.1
7.8
10.9
0.7
0.7
Surya Roshni
Neutral
174
-
764
3,342
3,625
7.8
7.5
17.3
19.8
10.1
8.8
19.2
15.4
10.5
10.8
0.5
0.4
MT Educare
Neutral
114
-
455
366
417
17.7
18.2
9.4
10.8
12.2
10.6
2.7
2.4
22.2
22.3
1.1
1.0
Radico Khaitan
Buy
111
147
1,472
1,667
1,824
13.0
13.2
6.7
8.2
16.6
13.5
1.5
1.4
9.0
10.2
1.3
1.1
Garware Wall Ropes
Neutral
630
-
1,379
873
938
14.3
14.3
35.2
37.5
17.9
16.8
3.1
2.7
17.5
15.9
1.5
1.4
Wonderla Holidays
Neutral
340
-
1,924
287
355
38.0
40.0
11.3
14.2
30.1
24.0
4.3
3.8
21.4
23.9
6.4
5.2
Linc Pen & Plastics
Neutral
230
-
340
382
420
9.3
9.5
13.5
15.7
17.1
14.7
2.9
2.5
17.1
17.3
1.0
0.9
The Byke Hospitality
Neutral
164
-
659
287
384
20.5
20.5
7.6
10.7
21.6
15.4
4.5
3.7
20.7
23.5
2.3
1.7
Interglobe Aviation
Neutral
825
-
29,823
21,122
26,005
14.5
27.6
110.7
132.1
7.5
6.3
44.6
31.9
168.5
201.1
1.4
1.1
Coffee Day Enterprises
Neutral
197
-
4,064
2,964
3,260
20.5
21.2
4.7
8.0
-
24.7
2.3
2.1
5.5
8.5
1.8
1.6
Ltd
Navneet Education
Neutral
111
-
2,636
1,062
1,147
24.0
24.0
6.1
6.6
18.2
16.7
3.7
3.3
20.6
19.8
2.6
2.4
Navkar Corporation
Buy
162
265
2,307
369
561
42.9
42.3
7.2
11.5
22.4
14.1
1.7
1.5
7.4
10.5
7.3
4.8
UFO Moviez
Neutral
410
-
1,132
619
685
33.2
33.4
30.0
34.9
13.7
11.8
1.9
1.6
13.8
13.9
1.5
1.2
VRL Logistics
Neutral
265
-
2,414
1,902
2,119
16.7
16.6
14.6
16.8
18.2
15.7
4.0
3.5
21.9
22.2
1.4
1.2
Team Lease Serv.
Neutral
876
-
1,497
3,229
4,001
1.5
1.8
22.8
32.8
38.5
26.7
4.1
3.6
10.7
13.4
0.4
0.3
S H Kelkar & Co.
Neutral
296
-
4,281
1,036
1,160
15.1
15.0
6.1
7.2
48.5
41.2
5.2
4.8
10.7
11.5
4.0
3.5
Quick Heal
Neutral
253
-
1,769
408
495
27.3
27.0
7.7
8.8
32.6
28.7
3.0
3.0
9.3
10.6
3.5
2.9
Narayana Hrudaya
Neutral
340
-
6,941
1,873
2,166
11.5
11.7
2.6
4.0
128.4
85.7
7.9
7.1
6.1
8.3
3.8
3.3
Manpasand Bever.
Neutral
529
-
3,028
836
1,087
19.6
19.4
16.9
23.8
31.3
22.2
3.8
3.3
12.0
14.8
3.4
2.5
Parag Milk Foods
Neutral
259
-
2,181
1,919
2,231
9.3
9.6
9.5
12.9
27.5
20.1
4.3
3.5
15.5
17.5
1.3
1.1
Mirza International
Buy
84
107
1,006
987
1,106
18.0
18.0
6.5
7.6
12.8
11.0
2.1
1.8
15.9
15.7
1.2
1.1
Asian Granito
Buy
214
351
645
1,071
1,182
12.1
12.4
12.7
16.0
16.8
13.4
1.6
1.4
9.5
10.7
0.9
0.8
Source: Company, Angel Research; Note: *December year end; #September year end; &October year end; Price as on December 23, 2016
Market Outlook
December 26, 2016
Research Team Tel: 022 - 39357800
DISCLAIMER
Angel Broking Private Limited (hereinafter referred to as “Angel”) is a registered Member of National Stock Exchange of India
Limited,Bombay Stock Exchange Limited and Metropolitan Stock Exchange Limited. It is also registered as a Depository Participant with
CDSL and Portfolio Manager with SEBI. It also has registration with AMFI as a Mutual Fund Distributor. Angel Broking Private Limited is a
registered entity with SEBI for Research Analyst in terms of SEBI (Research Analyst) Regulations, 2014 vide registration number
INH000000164. Angel or its associates has not been debarred/ suspended by SEBI or any other regulatory authority for accessing
/dealing in securities Market. Angel or its associates/analyst has not received any compensation / managed or
co-managed public offering of securities of the company covered by Analyst during the past twelve months.
This document is solely for the personal information of the recipient, and must not be singularly used as the basis of any investment
decision. Nothing in this document should be construed as investment or financial advice. Each recipient of this document should make
such investigations as they deem necessary to arrive at an independent evaluation of an investment in the securities of the companies
referred to in this document (including the merits and risks involved), and should consult their own advisors to determine the merits and
risks of such an investment.
Reports based on technical and derivative analysis center on studying charts of a stock's price movement, outstanding positions and
trading volume, as opposed to focusing on a company's fundamentals and, as such, may not match with a report on a company's
fundamentals. Investors are advised to refer the Fundamental and Technical Research Reports available on our website to evaluate the
contrary view, if any.
The information in this document has been printed on the basis of publicly available information, internal data and other reliable
sources believed to be true, but we do not represent that it is accurate or complete and it should not be relied on as such, as this
document is for general guidance only. Angel Broking Pvt. Limited or any of its affiliates/ group companies shall not be in any way
responsible for any loss or damage that may arise to any person from any inadvertent error in the information contained in this report.
Angel Broking Pvt. Limited has not independently verified all the information contained within this document. Accordingly, we cannot
testify, nor make any representation or warranty, express or implied, to the accuracy, contents or data contained within this document.
While Angel Broking Pvt. Limited endeavors to update on a reasonable basis the information discussed in this material, there may be
regulatory, compliance, or other reasons that prevent us from doing so.
This document is being supplied to you solely for your information, and its contents, information or data may not be reproduced,
redistributed or passed on, directly or indirectly.
Neither Angel Broking Pvt. Limited, nor its directors, employees or affiliates shall be liable for any loss or damage that may arise from
or in connection with the use of this information.